

Summit County Real Estate Market Update: August 2026
Summit County Real Estate Market Update: August 2026
Own Your Summit | Real Broker, LLC DBA Real
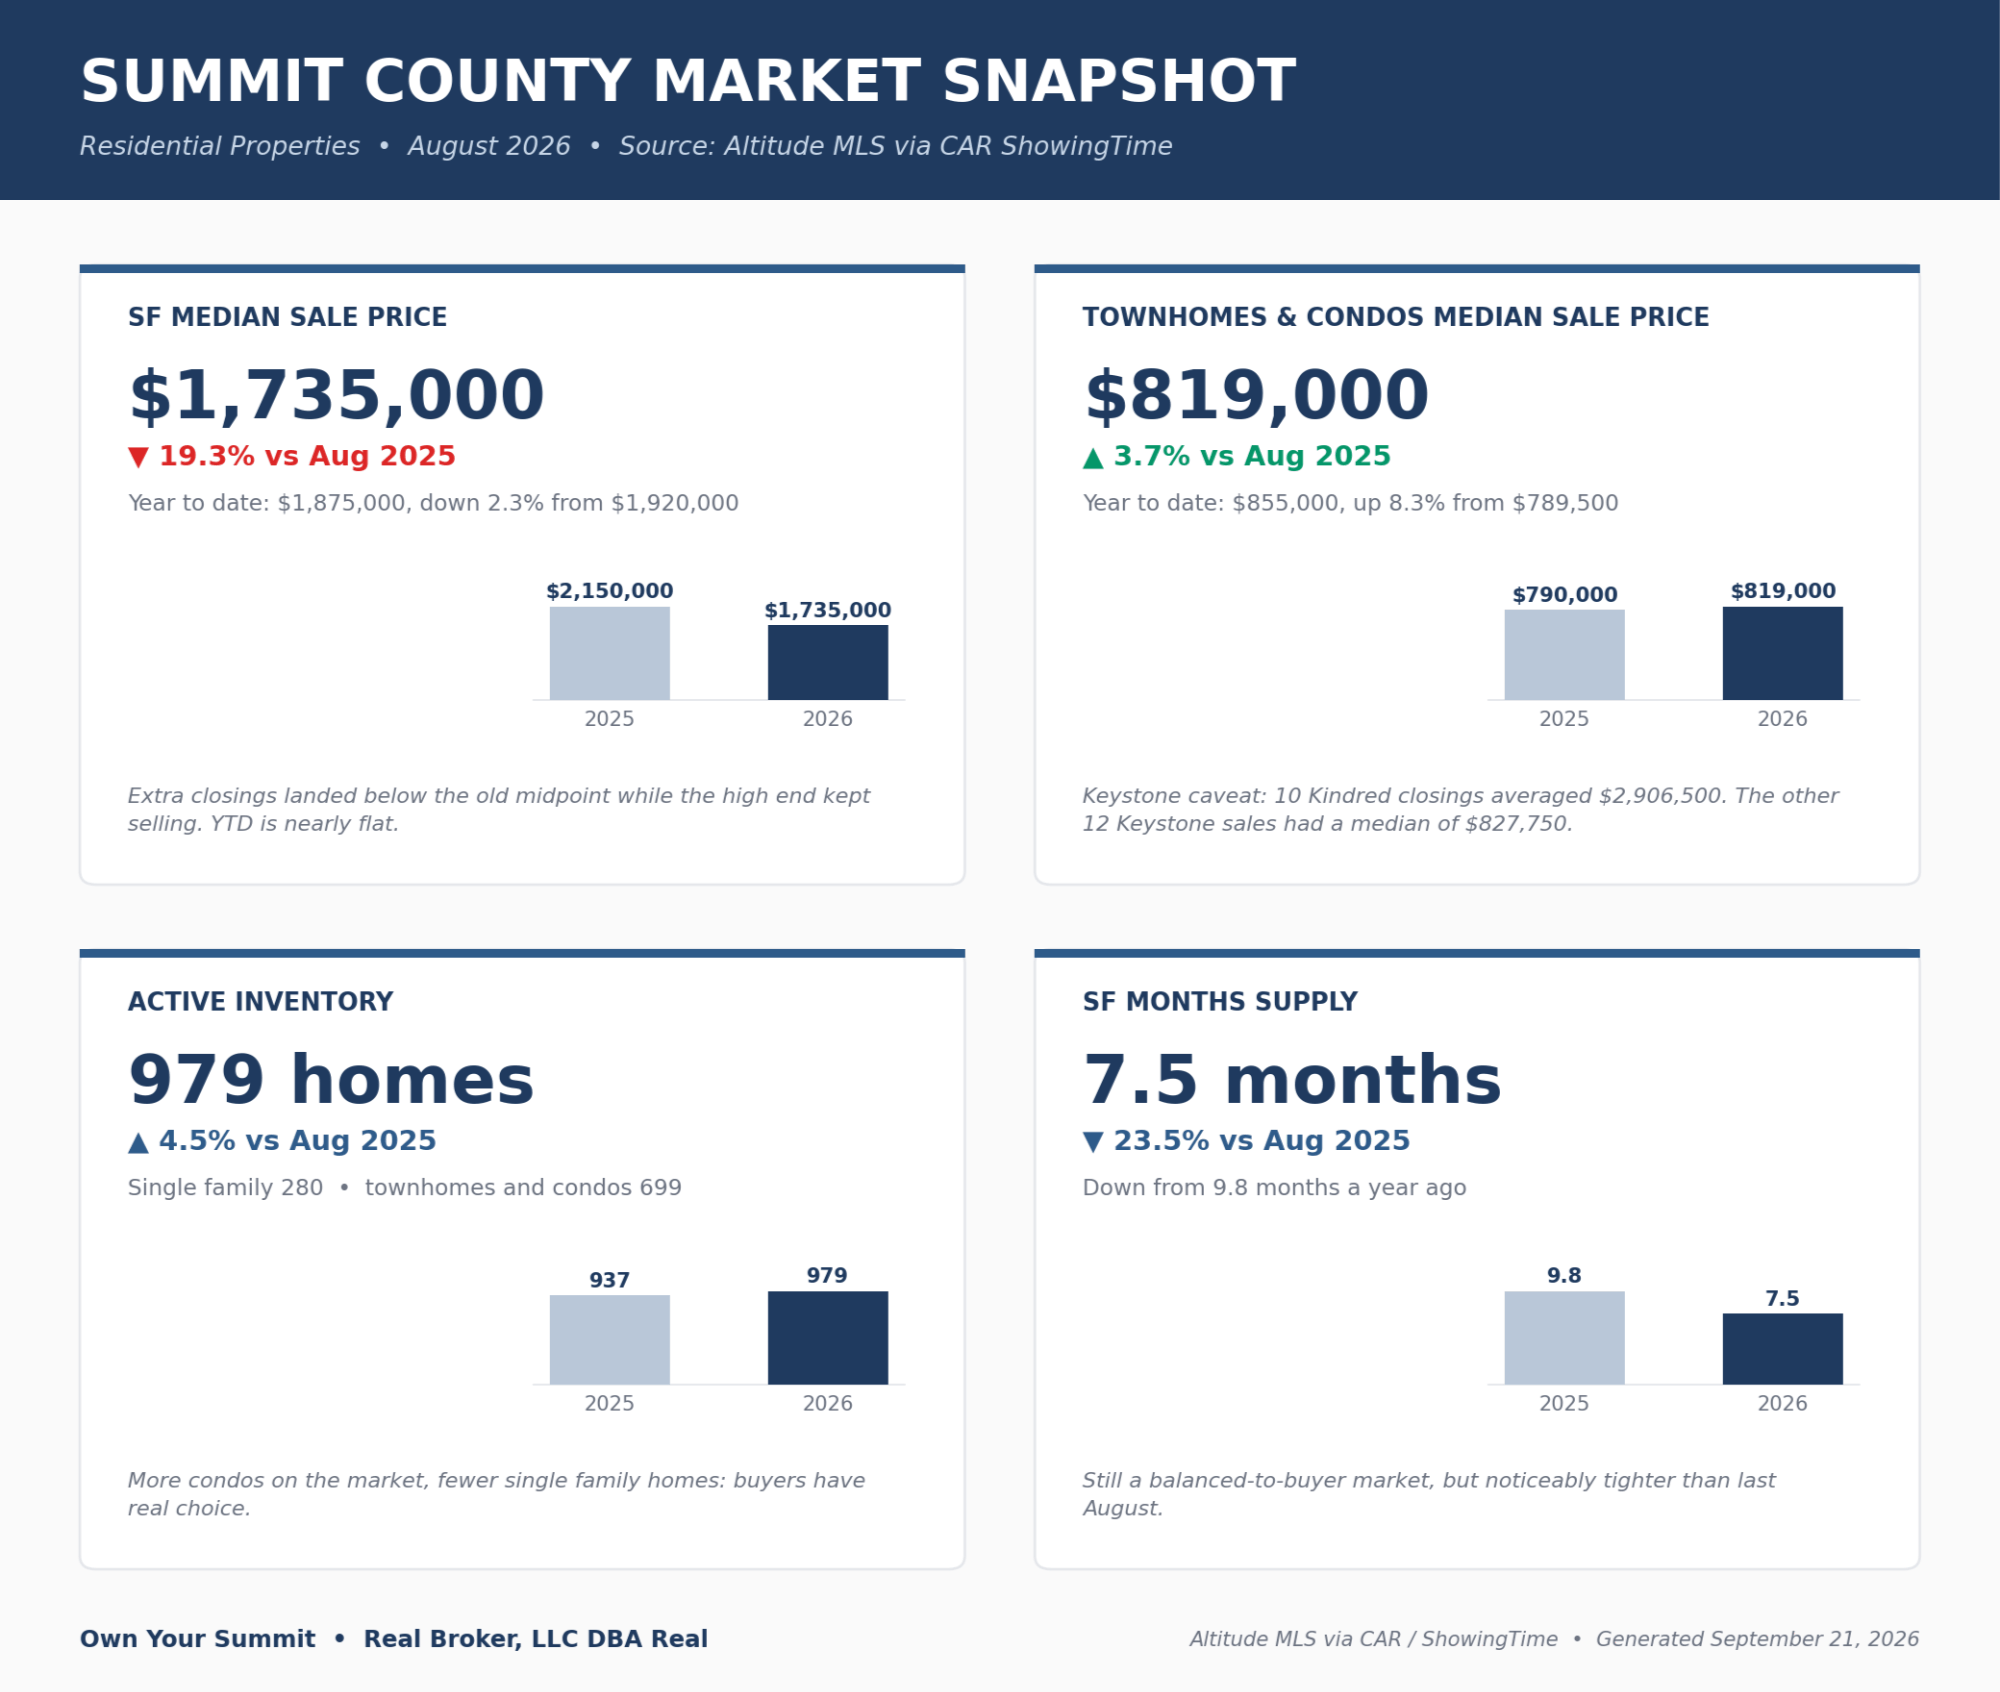
August was one of those months months where the headline number and the real story point in opposite directions. Some numbers we will talk about below will make it seem like home prices crashed others will make it look like sales spiked. When we look at the whole picture and you’ll see that in truth the Summit County market is holding steady year to date. Yes, we gave away the takeaway but we never want you to panic.
Forty-five single-family homes closed in Summit County, up 18.4% month over month. Ninety-three townhomes and condos closed, down 4.1%. Step back to the year-to-date view and the picture is steady: 243 single-family sales, down 0.8%, and 570 townhome and condo sales, down 0.9%.
New listings show a market that keeps refilling itself: 62 new single-family listings in August, up 5.1%, and 141 new townhome and condo listings, up 11.0%. Year to date, single-family new listings are down 1.3% while townhomes and condos are up 3.0%.
Single-Family Market
The single-family median landed at $1,735,000 in August, down 19.3% from $2,150,000 August 2025. Before you panic that your property just lost almost 20% in value, look at the year-to-date median of $1,875,000, off just 2.3%. The month moved. The year barely did. This just means that the specific homes that sold this month were less expensive than those that closed last August.
The average sale price illustrates this well. August averaged $2,163,893, up 0.7% year over year, with the year-to-date average at $2,335,959, down 1.7%. When the median falls and the average holds, what changed is the mix of homes that, not the overall value of the market. Even the percentage of list price to sale price stayed about the same from last year 96.1% compares to 96.9% this year.
As noted in one of our previous blogs the top end of the market continues to sell well. These higher dollar sales are part of what props up the average while the median fell. Breckenridge illustrates this well. Its August median was $1,875,000, down 25%, while its year-to-date median of $2,150,000 is up 9.1%. Dillon ran the other way entirely, posting an $1,850,000 August median, up 36.9%. Examples like this are a perfect example as to why you need a custom comparable market analysis for your specific home rather than just looking at the market averages. This is specifically true here in the mountains where stats per month can swing widely because we only have a handful of sales each month, for example only 19 sales in Breckenridge in August 2026.
Speed improved. Homes sold in a median of 29 days, down from 39 last August, though the year-to-date figure of 69 days is up 4.5%. Sellers received 96.9% of list price for the month, 96.3% year to date.
Townhomes and Condos
Townhomes and condos are carrying the price appreciation in this market. The August median was $819,000, up 3.7%, and the year-to-date median of $855,000 is up a strong 8.3% from $789,500. Average price ran hotter still: $1,132,616 for the month, up 14.1%, and $1,064,236 year to date, up 16.5%. These numbers are slightly inflated by a number of developments and high ended new construction closing. Keystone is a great example of this.
Keystone needs its own paragraph, because the headline number is misleading. Its August condo median of $1,380,000 is up 90.5%, and the year-to-date median of $1,250,000 is up 45.4%. Those are real closings, but they are not the resale market.
Here is the split. Ten of Keystone's August condo closings were in the Kindred development, averaging $2,906,500 with a median of $2,747,500, all of those sale at 100% of list price, which is typicall of new construction. The other 12 closings averaged $917,542 with a median of $827,750, at 97.61% of list and a median of 63 days. Translation: if you own a Keystone condo outside Kindred, your comparable number is $827,750, not $1,380,000. Pricing off the area averages without accounting for that difference would lead you to way over list and waste time on the market.
Frisco went the opposite direction for the month with a $787,500 median, down 32.7%, even though its year-to-date median of $960,000 is up 13.3%. BUT this is off literally only a handful of sales. Five to be specific. So again is ti more about the specific mix of homes that sold not the true full story about the market.
Countywide, units sold in a median of 75 days versus 93 last year, though year to date they are taking 83 days versus 73. Sellers received 97.4% of list price for both the month and the year.
Inventory and Supply
Inventory is the metric that splits this market in half. Single-family active listings fell to 280, down 11.7% from 317 a year ago, and months supply dropped to 7.5 from 9.8, a 23.5% decline. Townhomes and condos moved the opposite way: 699 active listings, up 12.7% from 620, with months supply climbing to 9.2 from 8.2.
Months supply is how long it would take to sell everything currently listed at the current pace. Under roughly four months favors sellers, above six favors buyers. Both types remain buyer-friendly, but the single-family side is tightening while the condo side loosens.
What the MLS Cannot See
MLS figures only capture what sold through the multiple listing service. Land Title Guarantee Company tracks every deed recorded at the County Clerk and Recorder, which picks up new construction, for-sale-by-owner, timeshare, and deed-restricted sales that never reach the numbers above.
Land Title recorded 180 Summit County transactions in August worth $260.3 million, with volume up 20% year over year. Of the 147 residential closings, 88 cleared $1 million, or 59% of everything that sold.
Two figures stand out. First, 38% of August closings were cash, no loan at all, so interest rates matter far less here than on the Front Range or the rest of the country. Land Title also tracks where buyers are coming from the year-to-date buyer profile runs 30% local, 34% Front Range, and 36% out-of-state. This has held pretty steady last August only saw 2% more local buyers.
What This Means for Buyers
If you are shopping for a single-family home, your window is narrower than last summer. Fewer listings and a 29-day median mean the good ones move. The upside: sellers are still accepting 96.9% of list, so there is room to negotiate on anything that has been sitting.
Condo buyers have more options and even more negotiating power. Nearly 700 active listings and 9.2 months of supply give you time, choice, and leverage. But the year-to-date median is up 8.3%, so waiting for prices to fall has not been a winning strategy here. Scroll back up a paragraph to remind yourself that more than 1/3 of homes in Summit County are owned cash-outright making those sellers less motivated to drop their price than in a traditional market.
What This Means for Sellers
Single-family sellers hold the stronger hand. Inventory is down 11.7%, months supply dropped nearly a quarter, and August homes sold in 29 days. Price it correctly and this market responds quickly.
Condo sellers face more competition than a year ago. With inventory up 12.7% and year-to-date days on market at 83 versus 73, your listing has to stand out on condition, photography, and price. The year-to-date median is still up 8.3%, so demand is there. What changed is how many choices buyers have, not their appetite.
Market Outlook: Looking Ahead
Heading into fall, expect the single-family side to stay tight. New listings are down 1.3% year to date and inventory is off 11.7%, so no wave of supply is coming. The condo side should stay well stocked, with 699 units already available.
The bigger takeaway is consistency. Volume, list-price ratios, and year-to-date medians all landed within a few points of last year. A single month can swing the median 19% and leave the annual trend nearly untouched. That is exactly what August did.
Waiting for the market to shift before you buy or sell in the last few years has meant you are likely still waiting. The best time to buy or sell if when it works for you personally.
Data from Altitude MLS, Inc. via the Colorado Association of REALTORS / ShowingTime Local Market Update. Generated September 21, 2026. Activity for one month can look extreme due to small sample size. Information deemed reliable but not guaranteed.
Categories
- All Blogs (106)
- Breckenridge (19)
- Buying a Home (36)
- Expired to Sold (2)
- Featured Listings (4)
- Frisco (1)
- Home Maintenance (8)
- Keystone (9)
- Lender Updates (7)
- Local Agent Guides (6)
- Local Businesses (10)
- Market Updates (15)
- Mountain Lifestyle (17)
- Park County (5)
- Selling a Home (15)
- Short Term Rentals (4)
- Summit County (72)
Recent Posts





GET MORE INFORMATION